This Report is a New 2022 Study which Makes an Objective Assessment of the Market for Cyber Security Software, Hardware and Services in Commercial Buildings from 2022 to 2027.
Our 2nd edition of research into the market for cyber security in smart commercial buildings focuses on market sizing and opportunities, AND provides a fresh assessment based on the latest available data and in-depth market analysis. New for 2022, it INCLUDES at no extra cost, a spreadsheet containing the data from the report AND a graphics pack with high-resolution charts.
KEY QUESTIONS ADDRESSED
- What is the size and structure of the global market for cyber security hardware, software & services? Memoori estimates that in 2021, global revenues for smart building cyber security reached $4.33 billion, and we expect the market to achieve a compound annual growth rate (CAGR) of 12.2% over the forecast period, rising to a combined value of $8.65 billion by 2027.
- What is best practice for End Users and Vendors? For the implementation of any new technology, cyber security needs to be considered throughout the design and build process, embedding the right security/privacy controls and risk mitigation solutions at each stage of development. Meeting the latest cyber security standards and getting IoT products officially certified can provide a clear competitive advantage for vendors when tendering for new business.
- What are the main drivers and challenges for industry growth? Cyber security consistently ranks as one of the top 3 concerns worrying organizations that are considering investment in IoT or digital transformation projects. Spending on cyber security has surged in recent years, driven by several major trends including the rise in ransomware attacks, a series of high-profile breaches and the massive security challenges posed by the transition to more remote work and the accelerated push for digital transformation.
- What does the competitive landscape look like? The market has attracted vendors with a range of different backgrounds and specializations. As well as being serviced by a number of niche, smart buildings-focused firms, the vendor landscape now includes a combination of players with backgrounds in building, ICT hardware/software, consulting, IT-focused cyber security software and service, OT/Industrial focused cyber security software & services and IoT device security.
The market sizing and forecasts presented in this report are based on a custom market model and iterative research methodology. Our research builds on decades of experience in the evaluation of a wide variety of smart building-related markets with a particular focus on tracking and evaluating the performance of a variety of technology markets and their impact on commercial buildings.
Our analysis indicates that the market will prove resilient despite a challenging global economic environment, as combined forces including the ever-increasing levels of digitization of built environment assets, the rising incidence of cyber-attacks, rising cost implications of successful data breaches, and increasingly stringent cyber security & privacy related legislation continue to spur spending growth.
WITHIN ITS 187 PAGES AND 37 CHARTS AND TABLES, THE REPORT FILTERS OUT ALL THE KEY FACTS AND DRAWS CONCLUSIONS, SO YOU CAN UNDERSTAND EXACTLY WHAT IS SHAPING THE FUTURE OF CYBER SECURITY IN COMMERCIAL BUILDINGS
- Arguably the most challenging aspect of effectively managing cyber risk for smart buildings is the major differences between historical approaches to systems design and operations, and divergent priorities between Information Technology (IT) systems and Operational Technology (IT) systems.
- Rising levels of cyber risk posed by IoT devices and connected smart building systems is having a significant adverse effect on building owners’ ability to effectively insure their assets, with some industry observers even going so far as to state that “the lack of effective cyber cover is rapidly becoming a leading barrier to smart building adoption moving forward”.
- A large proportion of smart building owners and operators could be totally unaware that they have no legitimate insurance cover for their smart building systems and would be fully liable for all associated costs in the event of a cyber breach – truly a concerning state of affairs.
Starting at only USD $2,500 (Single User License) This report provides valuable information to companies so they can improve their strategic planning exercises AND look at the potential for developing their business through mergers, acquisitions and alliances.
WHO SHOULD BUY THIS REPORT?
The information contained in this report will be of value to all those engaged in managing, operating and investing in commercial smart buildings (and their advisers) around the world. In particular, those wishing to understand the impact of cyber security on commercial real estate will find it most useful.
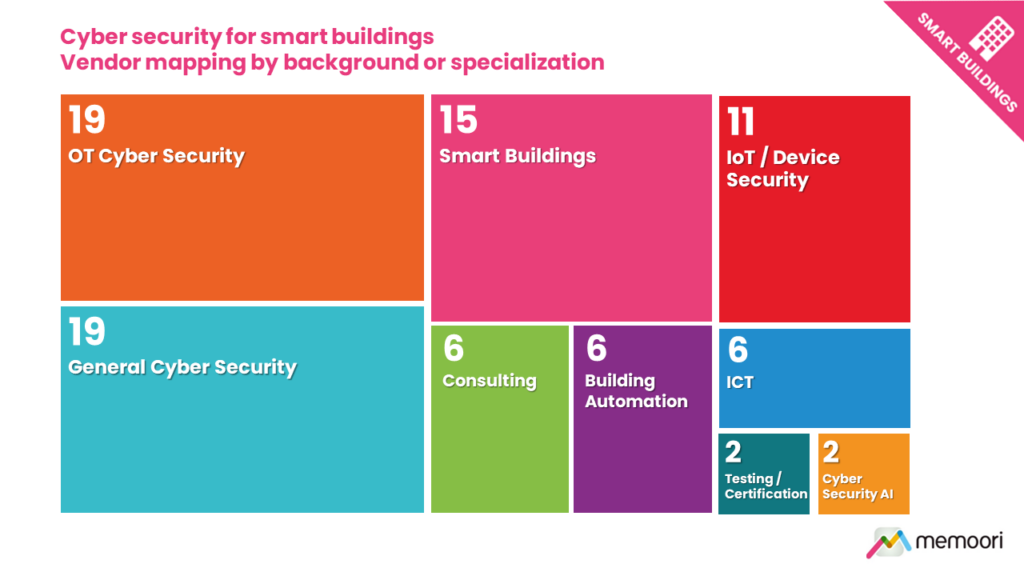
Table of Contents
- Preface
- The Executive Summary
- 1. The Cyber Threat Landscape
- 1.1 Cyber Security Threat Classifications
- 1.2 Cyber Security Attack Actors & Motivations
- 2. Cyber security in smart buildings
- 2.1 OT vs IT
- 2.2 IoT Adoption & Digital Transformation
- 2.3 The Role of AI
- 2.4 Smart Building Cyber Risk Evaluation
- 2.5 Disclosure & Reporting
- 2.6 Cyber Preparedness and Maturity
- 2.7 Cyber Insurance for Smart Buildings
- 2.8 Smart Building Cyber-Attack Statistics
- 2.9 Costs & Impacts
- 2.10 Case Studies of Smart Building Cyber-Attacks
- 3. Meta trends & their impacts
- 3.1 COVID-19
- 3.2 The War in Ukraine
- 4. The Global Market for Cyber Security in Smart Commercial Buildings
- 4.1 Hardware
- 4.2 Software
- 4.3 Services
- 5. Market Analysis by Region
- 5.1 Regional Comparisons
- 5.2 North America
- 5.3 Europe
- 5.4 Asia Pacific
- 5.5 Rest of the World
- 6. Vertical Market Status
- 6.1 Vertical Market Risk Profiles
- 6.2 Vertical Market Investment & Preparedness
- 6.3 Offices
- 6.4 Retail
- 6.5 Banking & Financial Services
- 6.6 Hospitality
- 6.7 Government
- 6.8 Healthcare
- 7. Market Drivers
- 7.1 Cyber Security & Data Privacy Concerns
- 7.2 Rising Cyber Security Spending
- 7.3 Rising Incidence & Cost Impacts
- 7.4 BIoT Market Growth
- 7.5 Regulatory & Legislative Drivers
- 8. Challenges & Barriers
- 8.1 Stakeholder Awareness
- 8.2 Ownership, Control & Divergent Priorities
- 8.3 Building Life-Cycles
- 8.4 Commissioning & Procurement
- 8.5 Skills, Education & Training
- 8.6 Vulnerability Monitoring
- 8.7 Market Fragmentation
- 9. Best Practice for End Users
- 9.1 Security by Design
- 9.2 Systems Visibility & Risk Assessment
- 9.3 Governance
- 9.4 Supply Chain & Vendor Risk Management
- 9.5 Network Protection
- 9.6 Security Information and Event Management (SIEM)
- 9.7 Incident Management & Recovery
- 10. Best Practice for Vendors
- 10.1 Security by Design
- 10.2 Certification & Standards Compliance
- 10.3 Independent Testing & Validation
- 10.4 Communications & Engagement
- 11. Standards
- 11.1 Cyber Security Standards
- 11.2 Building Specific Standards & Certifications
- 12. Other Relevant Tools & Initiatives
- 13. The Regulatory Environment
- 13.1 Cyber Security Regulations
- 13.2 Data Privacy Regulations
- 13.3 Cyber Vulnerability Disclosure
- 13.4 Cyber Breach Disclosure
- 14. The Smart Building Cyber Security Vendor Landscape
- 14.1 Vendor Mapping
- 15. Partnerships & Alliances
- 16. Investment & M&A
- 16.1 Venture Funding
- 16.2 M&A Deals
- 1. The Cyber Threat Landscape
List of Charts and Figures
- Fig 1.1 – Distribution of cyber attacks by motivation Q2 2021 to Q2 2022
- Fig 2.1 – Internet of Things in smart commercial buildings 2022
- Fig 2.2 – Installed base of IoT devices in commercial smart buildings 2019 to 2027
- Fig 2.3 – Commercial smart building IoT devices by Application
- Fig 2.4 – Cyber threats of greatest concern amongst OT cyber security practitioners
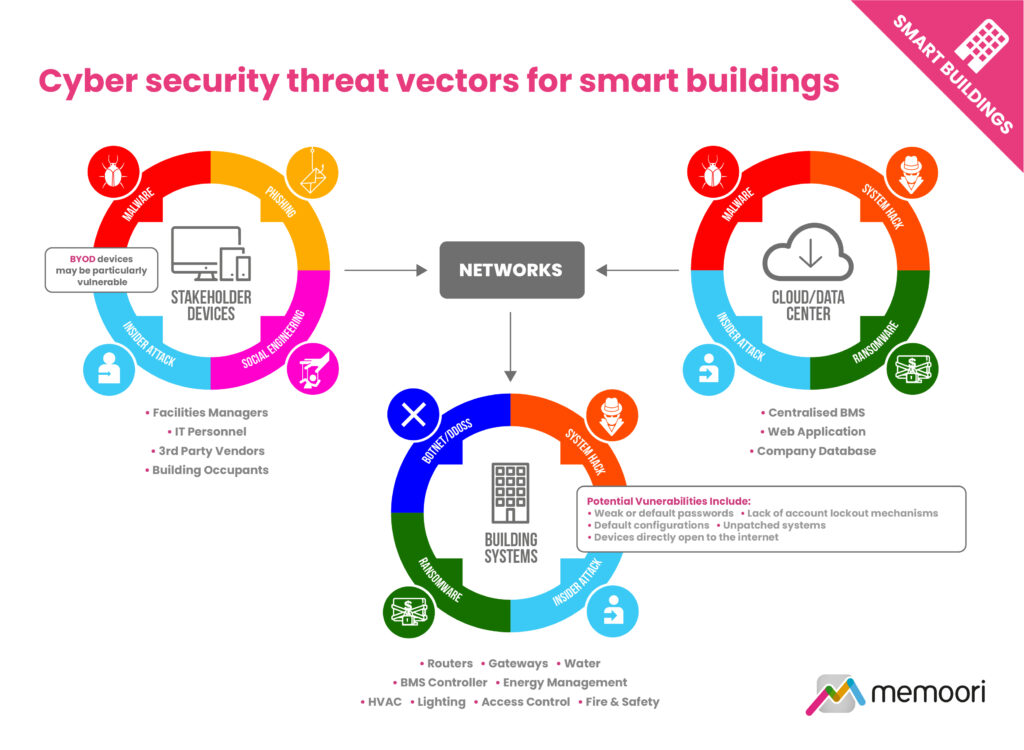
- Fig 2.5 – Cyber security threat vectors for smart buildings
- Fig 2.6 – Control system components perceived to be at greatest risk
- Fig 2.7 – Percentage of organizations with an IoT device vulnerability disclosure policy
- Fig 2.8 – Average weekly cyber attacks per organization Q1 2021 to Q2 2022
- Fig 2.9 – Percentage of ICS computers on which malicious objects were blocked
- Fig 2.10 – Percentage of facilities managers that have experienced a breach during the past 12 months
- Fig 2.11 – Cyber intrusions experienced by OT organizations
- Fig 2.12 – Average total cost of a data breach $ millions
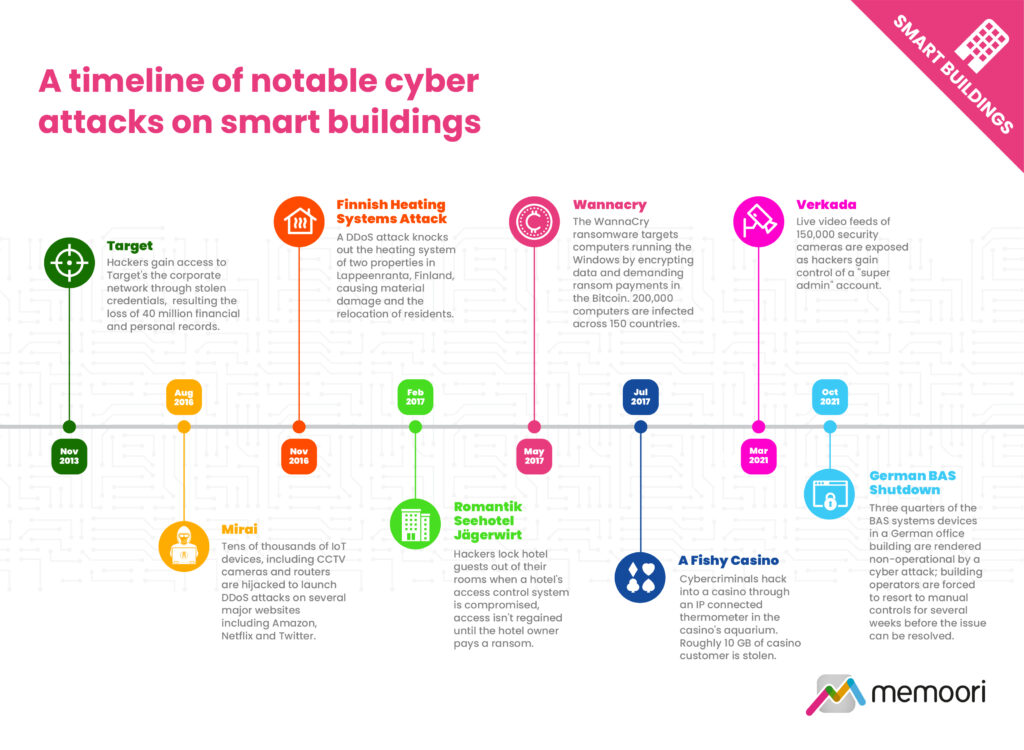
- Fig 2.13 – A timeline of notable cyber attacks on smart buildings
- Fig 4.1 – Cyber security in smart commercial buildings, revenue by hardware, software & services, $ billions 2021 to 2027
- Fig 5.1 – Cyber security in smart commercial buildings revenue by region, $ billions 2021 to 2027
- Fig 5.2 – Cyber attacks by region, 2021 vs 2020
- Fig 5.3 – The market for cyber security in smart commercial building, North America, $ millions 2021 to 2027
- Fig 5.4 – The market for cyber security in smart commercial building, Europe, $ millions 2021 to 2027
- Fig 5.5 – The market for cyber security in smart commercial building, Asia Pacific, $ millions 2021 to 2027
- Fig 5.6 – The market for cyber security in smart commercial building, Rest of the World, $ millions 2021 to 2027
- Fig 6.1 – Perception of industries most at risk of cyber attack
- Fig 6.2 – Cyber incidents and breaches by industry
- Fig 6.3 – Ransomware incidents by industry 2021
- Fig 6.4 – Commercial smart building IoT device projections by market vertical 2022 to 2027
- Fig 6.5 – Vertical market cyber security risk matrix
- Fig 6.6 – Cyber security spending by vertical
- Fig 6.7 – Cyber maturity & preparedness by Vertical
- Fig 7.1 – Percentage of facilities managers that consider cyber security a concern
- Fig 7.2 – Cyber budgets in 2022
- Fig 8.2 – Biggest challenges faced in securing OT technologies & processes
- Fig 8.3 – IT vs OT Data Priorities
- Fig 8.4 – Supply chain stakeholder challenges & priorities
- Fig 8.5 – Building component life-cycles
- Fig 9.1 – Typical cyber security roles, responsibilities and outputs for smart buildings
- Fig 9.2 – Summary of network protection & threat mitigation methods
- Fig 10.1 – Smart building vendor cyber security compliance
- Fig 14.1 – Vendor mapping by background or specialization
- Fig 16.1 – Leading recipients of venture funding
Companies Mentioned INCLUDE (but NOT limited to)
5Q Cyber | Acalvio Technologies | Accenture | Advent IM Ltd | Arctic Wolf | Armis Security | AWS | Axonius | Backbone Connect | Blackpoint Cyber | Buildings IOT | Cato Networks | Check Point | Cisco | Claroty | CommandScape | Cybeats | CyberArk | Cyberbit | CyberReady LLC | Darktrace | Deloitte | Dragos Inc | Finite State | FlamencoTech | Forescout Technologies | Fortinet | Hitachi Systems Security | Honeywell | Hypervision Technology | Ideal | Industrial Defender | Intelligent Buildings, LLC | ioTium | Johnson Controls | Juberi Group | Juniper Networks | Kaspersky Lab | LOCH Technologies | Microsoft | Mocana | Nelysis | NortonLifeLock | Nozomi Networks | Onclave Networks | Palo Alto Networks | Pen Test Partners | Perygree | Prescriptive Data | Qualys | Radiflow | Rapid7 | SAM Seamless Network | ScadaFence | Schenider Electric | Sectrio | SecuriThings | Seqred | Sequitur Labs | ShieldIOT | Siemens | SIGA | Skybox Security | Tanium | TCS | Telos | Tempered | Tenable | Thales | Trellix | Trend Micro | Tripwire | Veridify Security | Versa Networks | Waterfall Security | Zingbox
DOWNLOAD THE BROCHURE OR CONTACT US DIRECTLY TO DISCUSS ALTERNATIVE PAYMENT OPTIONS.