New Memoori Research on the Security Industry shows that in 2013 demand continues to grow as its structure strengthens and becomes more effective - http://memoori.com/portfolio/the-physical-security-business-in-2013/
The total value of world production of security products at factory gate prices in 2013 was $23.4 billion. Of this Video Surveillance products at $12.26 billion took a share of 52%; Access Control at $5.11 billion took a 22% share and Intruder Alarms at $6 billion has a 26% share.
The developed markets of North America and Europe are losing market share to Asia and particularly China, which will be the largest single market by the end of this decade.
In 2013, combined product sales grew by 8% with growth in the Video Surveillance sector achieving 12%, access control 9% and intruder alarms 2%. It is the growth in IP Network video surveillance at around 30% that has made the major contribution and pushed up the demand for physical security equipment.
The report shows that the industry is wringing out more sales and investment dollars than could be expected given the poor trading conditions across the globe. It’s robust performance is not the direct result of increased concern about crime and terrorism but is the fact that the industry is delivering products and services that meet customer value propositions such as increasing productivity, reducing operating costs whilst delivering an improving ROI. This is gradually changing the buyer culture from believing that physical security is a pure cost centre to a profit centre and elevating its importance in the fight for capital investment.
From our detailed analysis of the structure of the industry it is clear that this renaissance is being led by a small band of companies that are relatively “new starts” in the business. They have taken the opportunity to use emerging technologies to produce products that can deliver on customer’s requirements.
These companies are pure product manufacturers and for the most part focused on one sector of the physical security market, Access Control, Intruder Alarms or Video Surveillance. They are making the business much more effective without so far using M&A as the main tool for growth.
Right from our first report 6 years ago we elected to split the industry into 3 main groups. Group A comprises 15 major conglomerates, having sales of over $1 billion and total product sales of $8.75 billion accounting for 37% of total business and giving an average sales value of $583m in 2013.
The reason that this figure is much lower than the minimum size for this group is that virtually all these companies receive substantial revenues for selling total systems and many are involved in supplying security products, systems and services outside the physical security products domain and we have had to adjust for this fact.
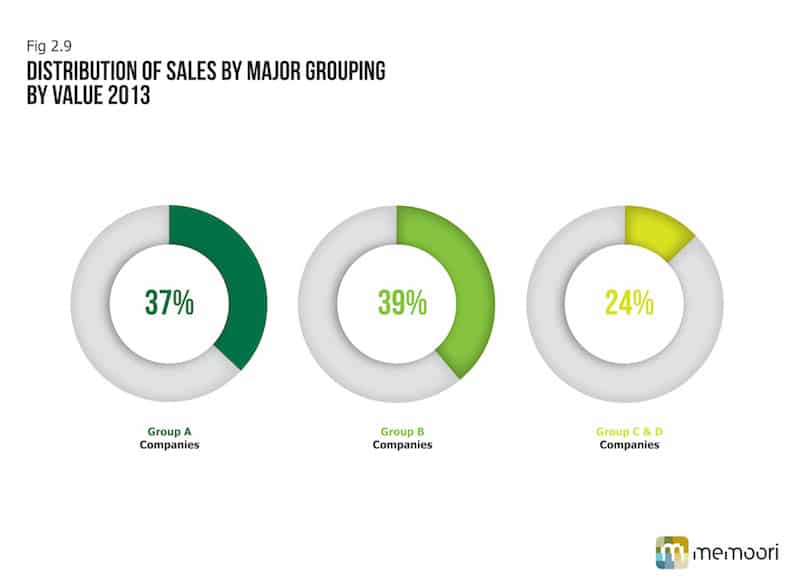
In Group B companies having sales of over $100m but less than $1 billion, number approximately 50 and they shared sales of $8.86 billion giving an average value of $177 million and a share of 39% of the total market. The vast majority of these companies only manufacture physical security products.
Finally we estimate that there are 900 companies in Group C and D sharing $5.67 billion making an average revenue of $6.3 million and a total share of 24%.
The general trend that we have identified over the last 5 years is that Group A has lost share to Groups B and C. Group B includes the majority of fast growing companies in the business with most focused on one sector and supply only products and never install systems.
Whilst this has been an effective tool to chart changes in the structure of the industry it should be understood that analyzing company market share across all 3 businesses could give a distorted picture because not all operate across the 3 sectors. A good example of this can be seen in Video Surveillance where a number of Group B companies have specialised and are amongst the leading suppliers.
Axis Communications currently have annualised sales of around $700 million and 5.7% of the total Video Surveillance product market. A number of market research companies estimate that this gives them a market share of around 40% of the IP Camera business. We think that this is a little high but it does look as though they will increase their share if they continue to grow at 20% per annum over the next few years.
None of the major Group A companies can match this share, but they will get closer when based on all types of cameras including analogue, a product that is losing market share year on year.
Until 4 years ago players in Group A relied heavily on strategic acquisitions to increase or at least maintain their share of the market but the major conglomerates have withdrawn from the dealing tables. In 2013 consolidation measured by the value of deals has been driven by players in Group B with the exception of 2 players in Group A. Whilst the organic content still contributes most to Group B companies growth, they are now using strategic acquisitions to increase both their capability and capacity to move ahead.
One of the conundrums that the report throws up is why have western leading edge suppliers failed to establish a strong growing share of the Chinese market? Without growth here they will miss out on the world’s fastest growing and soon to be the largest single market in the world.