
This Report is a new 2023 Study which Makes an Objective Assessment of the Commercial Building IoT Market Size & Competitive Landscape to 2028
Our new report focuses on market sizing, applications and opportunities in the Internet of Things market, as well as a comprehensive evaluation of the drivers and barriers to adoption that are specific to the Commercial Real Estate sector.
New for 2023, it INCLUDES at no extra cost, a spreadsheet containing the data from the report AND high-resolution presentation charts showing the key findings. It is the second instalment of a two-part series, with the first report (published last month) covering IoT Device Projections, Adoption & Meta-Trends Analysis. These reports are included in our 2023 Premium Subscription Service.
KEY QUESTIONS ADDRESSED
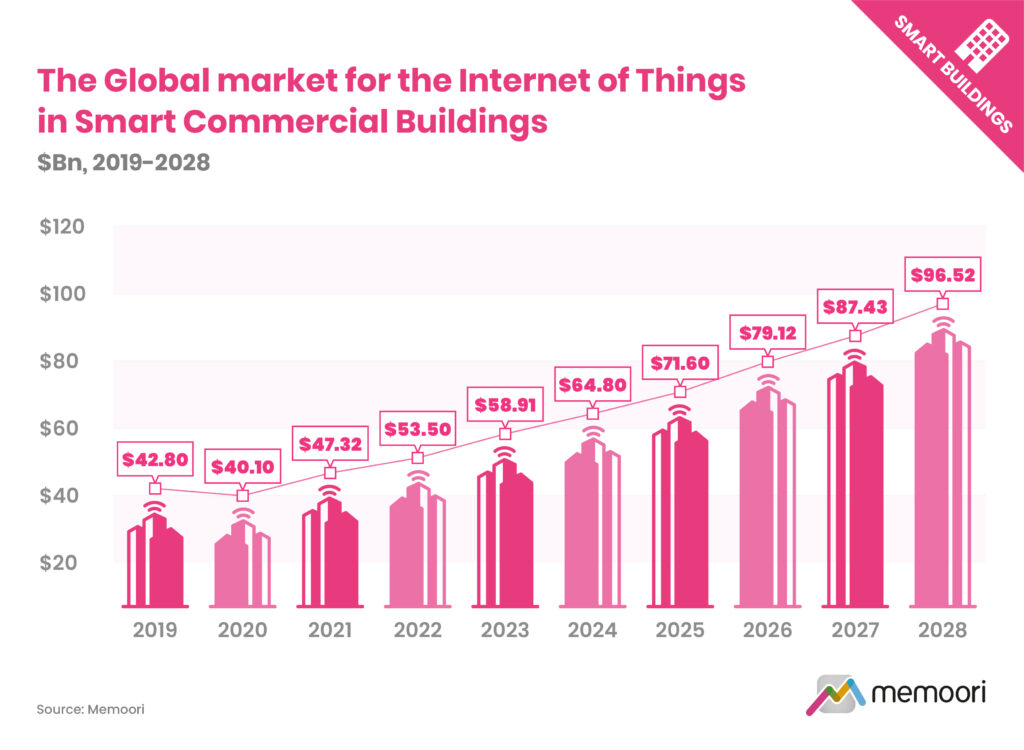
- What is the Size of the Internet of Things Market in Smart Commercial Buildings (BIoT)? Our latest analysis indicates that the BIoT market grew to $53.5 billion in 2022, representing a 13% rise from 2021. Performance was slightly down from our forecast of 13.8% for the year due to several factors, including a slower-than-anticipated overall economic recovery, a lack of chipsets, and disrupted supply chains. Memoori forecasts that the BIoT market size will grow at a CAGR of 10.33% to $96.5 billion between 2022 and 2028.
- What is Driving BIoT Market Adoption? Real estate stakeholders are investing not only to improve the sustainability credentials of their assets but also to enhance their performance, resulting in better rent and yields. As rising energy costs are expected to continue increasing, the focus on energy-efficient technologies and sustainable solutions is likely to remain a significant priority for many companies.
- What Challenges & Barriers Does the BIoT Market Face? Cybersecurity is a crucial consideration for the growing number of smart buildings, which are increasingly susceptible to cyber attacks. Smart building systems and devices often lack dynamic patching capabilities, and facilities management teams may lack the IT skills required to manage cybersecurity.
The building sector is making progress towards sustainable development and reducing energy consumption. The EIA’s 2018 CBECS consumption and expenditures survey found that commercial buildings consumed 12% less energy per square foot of floorspace in 2018 than in 2012. However, the building sector still falls short of the targets required for sustainable future development, as buildings and building construction contribute to one-third of global energy consumption and almost 40% of CO2 emissions.
To achieve net zero by 2050, building owners and operators must redouble their efforts in new construction and retrofits. The IEA is now calling for an increase in retrofit rates of 2.5% annually by 2030, up from less than 1% today.
WITHIN ITS 236 PAGES AND 26 CHARTS AND TABLES, THE REPORT FILTERS OUT ALL THE KEY FACTS AND DRAWS CONCLUSIONS, SO YOU CAN UNDERSTAND EXACTLY WHAT IS SHAPING THE FUTURE OF THIS GLOBAL IOT MARKET
- The Building Internet of Things market is complex and multifaceted, involving a wide range of players from traditional building automation companies to specialized manufacturers, ICT vendors, property firms, and software vendors offering middleware, platforms, and cloud-based data analytics services. While some companies offer end-to-end BIoT solutions, others specialize in specific areas such as data intelligence, automation, or energy optimization and analytics.
- The smart building startup landscape is also expanding rapidly, with a 20% increase in the number of new entrants founded since 2021. Consolidation is expected in the wider platforms space, but there remain considerable market opportunities for cloud-based software offerings for specialist applications or vertical markets.
- While the level of fragmentation in the BIoT market can act as a source of confusion and frustration for buyers, leading platform solution providers are beginning to emerge, and the user base seems likely to coalesce around a more limited number of platform providers.
At only USD $2,000 (Enterprise Wide License) this report provides valuable information to companies so they can improve their strategic planning exercises AND look at the potential for developing their business through mergers, acquisitions and alliances.
WHO SHOULD BUY THIS REPORT?
The information contained in this report will be of value to all those engaged in managing, operating and investing in commercial smart buildings (and their advisers) around the world. In particular, those wishing to understand exactly how the Internet of Things is impacting commercial real estate will find it most useful.
ALIGNING STAKEHOLDER PRIORITIES
The infographic below illustrates key stakeholders in a smart building project, their priorities and KPIs, and the project phases they might be involved in under traditional and best practice approaches. Encouraging collaboration, communication, and standardized practices among stakeholders can help bridge the gap and foster innovation.
The integration of Internet of Things technology into building design is a complex process that requires coordination and alignment among all parties involved. A comprehensive and cohesive design approach involving key stakeholders from the earliest stages leads to improved decision-making and better outcomes.
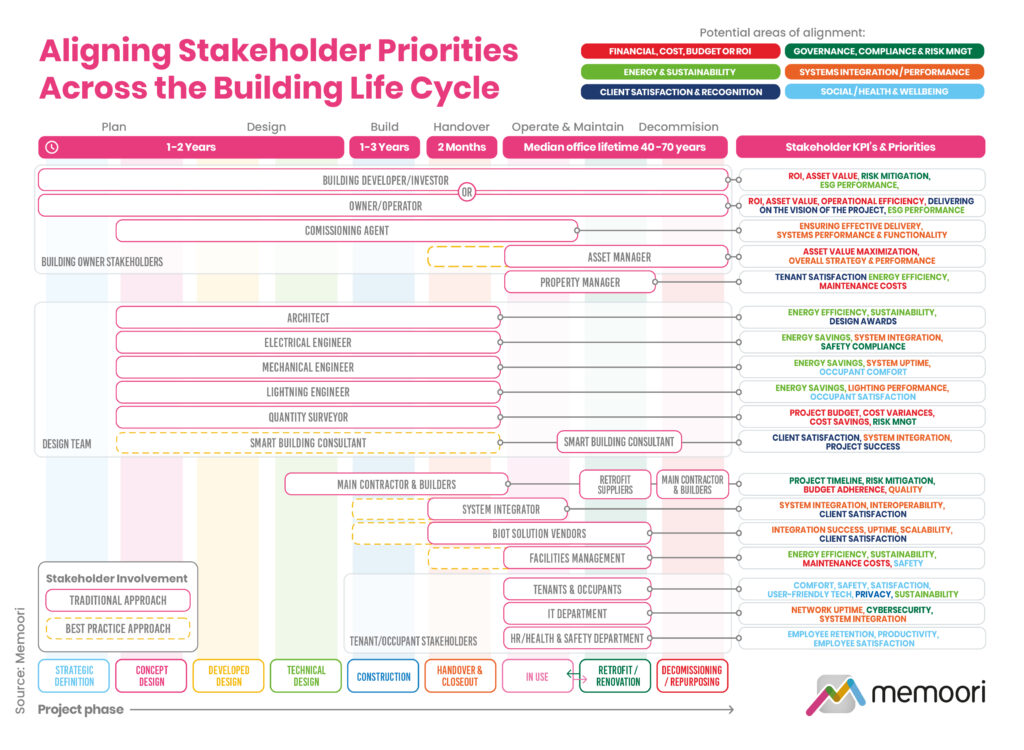
Table of Contents
- Preface
- The Executive Summary
- 1. Introduction
- 1.1 Overview of the IoT Market in Smart Commercial Buildings
- 1.2 The BIOT Supply Chain
- 2. Market Sizing and Regional Analysis
- 2.1 BIoT Global Market Forecasts
- 2.1.1 Market Revenue by Hardware, Software & Services
- 2.1.2 Market Revenue by Vertical
- 2.1.3 Market Revenue by Application
- 2.2 BIoT Market Analysis by Region
- 2.2.1 Regional Comparisons
- 2.2.2 North America
- 2.2.3 Latin America
- 2.2.4 Asia Pacific
- 2.2.5 Europe
- 2.2.6 Middle East & Africa
- 2.1 BIoT Global Market Forecasts
- 3. BIoT Market Applications
- 3.1 Security & Access Control
- 3.1.1 Video Surveillance
- 3.1.2 Video Management Systems (VMS)
- 3.1.3 Video Surveillance as a Service (VSaaS)
- 3.1.4 Access Control
- 3.1.5 AI Applications for Security & Access Control
- 3.2 Energy Management & Environmental Control
- 3.2.1 The Role of IoT and AI in Energy Management
- 3.2.2 Real-Time Energy Tracking and Analysis
- 3.2.3 HVAC Optimization
- 3.2.4 Balancing Priorities and Integrating Multiple Systems
- 3.2.5 The Future of Energy Management and Environmental Control
- 3.3 Grid Interactive Buildings
- 3.3.1 Demand Response and Load Management
- 3.3.2 Demand-Side Management Strategies
- 3.3.3 Load Shedding and Peak Shaving
- 3.3.4 Integrating Renewables and PEV’s
- 3.3.5 Leading Players in Grid Interactive Buildings
- 3.4 Smart Operations & Maintenance
- 3.5 Space, Occupancy & People Movement
- 3.6 Air Quality
- 3.7 Hygiene, Health & Wellness
- 3.8 Smart Lighting
- 3.9 Tenant & Workplace Experience
- 3.10 Fire & Safety
- 3.11 Waste & Water Management
- 3.11.1 Water Management
- 3.11.2 Waste Management
- 3.12 Digital Twin
- 3.12.1 Defining Digital Twins
- 3.12.2 The Relationship Between Digital Twins, BIM & IoT
- 3.12.3 3D Modelling for Digital Twins
- 3.12.4 Challenges & Criticisms
- 3.12.5 Prerequisites for Successful Digital Twins
- 3.12.6 Market Perceptions & Adoption Rates
- 3.12.7 Digital Twin Vendors
- 3.1 Security & Access Control
- 4. Smart Building IoT Platforms
- 4.1 IoT Platforms
- 4.2 The BIoT Platform Eco-System
- 4.3 BIoT Platform Offerings
- 5. Prospects & Use Cases by Market Vertical
- 5.1 Commercial Offices
- 5.2 Retail
- 5.2.1 Retail Sector Performance
- 5.2.2 The Future of Retail
- 5.2.3 Retail Sector IoT Opportunities
- 5.3 Hospitality
- 5.3.1 Hotels
- 5.3.2 Restaurants & Food Services
- 5.4 Data Centers
- 5.5 Other Verticals
- 5.5.1 Transport
- 5.5.2 Public Assembly/Venues
- 5.5.3 Warehouses
- 5.6 Smaller Buildings
- 6. BIoT Market – Adoption Drivers
- 6.1 Economic & Business Drivers
- 6.1.1 Operational Cost Savings and Efficiency Gains
- 6.1.2 Tenant Priorities & Property Value
- 6.1.3 Workplace Demands & Expectations
- 6.2 Technology Drivers
- 6.2.1 Technology Costs
- 6.2.2 Data Volume & Accessibility
- 6.2.3 Emerging Technologies
- 6.3 Energy Efficiency & Sustainability Drivers
- 6.3.1 Sustainability Performance in the Commercial Building Sector
- 6.3.2 The Critical Importance of Retrofits
- 6.3.3 Corporate Attitudes, Investments, and Initiatives
- 6.3.4 Energy Cost-related Drivers
- 6.3.5 ESG Reporting
- 6.3.6 Countering the Adverse Impacts of the IoT
- 6.4 Health & Wellbeing Drivers
- 6.5 Government Policies & Regulations
- 6.5.1 Environmental and Sustainability Regulations
- 6.5.2 Government Incentives and Subsidies
- 6.5.3 IoT, Data & Cybersecurity Regulations
- 6.5.4 Other Investment or Policy Drivers
- 6.6 Standards & Certification
- 6.6.1 The Evolving Landscape of Building Standards & Certifications
- 6.6.2 Smart & Digital connectivity
- 6.6.3 Sustainability, Energy & ESG performance
- 6.6.4 Health & Wellbeing
- 6.6.5 Cybersecurity Standards and Requirements
- 6.1 Economic & Business Drivers
- 7. BIoT Market – Challenges & Barriers
- 7.1 Technology Challenges
- 7.1.1 Cybersecurity
- 7.1.2 Cyber Insurance
- 7.1.3 Data Privacy
- 7.1.4 Systems Complexity & Interoperability
- 7.1.5 Data Related Challenges
- 7.2 Resistance to Change and Industry Evolution
- 7.2.1 Resistance to Change in the CRE Industry
- 7.2.2 Industry evolution and transition drivers
- 7.3 Leadership, Commissioning & Procurement
- 7.3.1 IoT Project Leadership & Decision Makers
- 7.4 Building Life Cycles
- 7.5 Commissioning, Procurement & Stakeholder Alignment
- 7.5.1 Commissioning & Procurement Challenges
- 7.5.2 Stakeholder Priorities Across the Building Life Cycle
- 7.5.3 Achieving Stakeholder Alignment
- 7.5.4 Effective Integration of IoT Technology into Building Design
- 7.5.5 IT vs OT Stakeholders
- 7.5.6 Landlord/Tenant split incentives
- 7.6 Costs & Business Case Development
- 7.6.1 IoT Project Costs
- 7.6.2 Business Case Development
- 7.1 Technology Challenges
- 8. The Competitive Landscape
- 1. Introduction
List of Charts and Figures
- Fig 1.1 – The Internet of Things in Smart Commercial Buildings 2023 v5.1
- Fig 1.2 – The BIoT Supply Chain
- Fig 2.1 – The Global Market for the Internet of Things in Smart Commercial Buildings, $Bn 2019-2028
- Fig 2.2 – The Global Market for the Internet of Things in Smart Commercial Buildings, Breakdown by Hardware, Software, & Services, $Bn 2022-2028
- Fig 2.3 – Market Breakdown by Hardware, Software & Services, Market Size $Bn, % of Total Market
- Fig 2.4 – The Market for the Internet of Things in Smart Commercial Buildings Market by Vertical, $Bn 2022 & 2028
- Fig 2.5 – The Market for the Internet of Things in Smart Commercial Buildings Market by Application, $Bn 2022 & 2028
- Fig 2.6 – Regional Growth Indicators
- Fig 2.7 – The Market for the Internet of Things in Smart Commercial Buildings Market by Region 2022 to 2028, % of Global Market
- Fig 2.8 – BIoT Related Patent Applications by Country, May 2023
- Fig 2.9 – Percentage Share of Academic Publications, Selected Technologies
- Fig 2.10 – Frontier Technology Readiness by Region
- Fig 2.11 – The Market for the Internet of Things in Smart Commercial Buildings North America, $Bn 2022 – 2028
- Fig 2.12 – The Market for the Internet of Things in Smart Commercial Buildings Latin America, $Bn 2022 – 2028
- Fig 2.13 – The Market for the Internet of Things in Smart Commercial Buildings Asia Pacific, $Bn 2022 – 2028
- Fig 2.14 – The Market for the Internet of Things in Smart Commercial Buildings Europe, $Bn 2022 – 2028
- Fig 2.15 – The Market for the Internet of Things in Smart Commercial Buildings Middle East & Africa, $Bn 2022 – 2028
- Fig 4.1 – Typical IoT Platform Functionality
- Fig 6.1 – Price Inflation for Information Technology, Hardware & Services since 1988
- Fig 6.2 – Non-Residential Building Sector CO2 Emissions 2010 – 2030
- Fig 6.3 – Buildings Share of Global Final Energy & CO2 Emissions 2021
- Fig 6.4 – Average Electricity & Gas Prices for Non-Household Consumers
- Fig 7.1 – Building Component Life Cycles
- Fig 7.2 – Aligning Stakeholder Priorities Across the Building Life Cycle
Internet of Things Companies Mentioned INCLUDE (but NOT limited to)
75F | Aclara | Acuity Brands | ADT | AiFi | Airthings | Akila | Allegion | ambx | Assa Abloy | Augury | Aukett Swanke | AutoGrid | Avigilon | AWS | Axis Communications | Bentley Systems | Bigbelly | Blue Pillar | Bosch | Brainbox AI | Butlr | ButterflyMX | Carrier | CBRE | Controlsoft | Cooper Lighting | Cushman & Wakefield | Density | Dormakaba | Eagle Eye Networks | EcoEnergy Insights | Enevo | Enlighted | EnOcean | Eseye | FacilityConneX | Fingerprint Cards | Genetec | Google | Haltian | Hanwha Techwin | HID Global | Hikvision | Honeywell | HqO | Huperlab | IBM | IDEMIA | Identiv | Infogrid | Invixium | iOffice | IPCOnfigure | JLL | Johnson Controls | Kimberly Clarke | Kisi | Knight Frank | Lane | Legrand | Lensec | Lindstrom | LogCheck | March Networks | Matterport | Measurabl | Metrikus | Microsoft | Neptune Technology Group | Okta | OpenEye | Openpath | Oracle | Planon | Rise Buildings | Roadrunner Recycling | Robin | Salient | SAP | Savills | Schneider Electric | Senseware | Siemens | SmartBin | Space IQ | Spacewell | Spintly | Standard Cognition | Suprema | Switch Automation | Thoughtwire | Trigo | uHoo | UL | VergeSense | Verkada | Vesta Wind Systems | VTS | Vue | Wattstopper | WiredScore | Xylem Water Solutions | Zippin
DOWNLOAD THE BROCHURE OR CONTACT US DIRECTLY TO DISCUSS ALTERNATIVE PAYMENT OPTIONS.