This Report is a New 2023 Study into IoT Device Projections, Adoption & Meta-Trends Analysis
Our new research into IoT devices in commercial real estate focuses on the installed base of IoT devices. It provides a completely fresh assessment of the industry based on the latest information.
New for 2023, it INCLUDES at no extra cost, a spreadsheet containing the data from the report AND high-resolution presentation charts showing the key findings. It is the first instalment of a two-part series, with the second report (published later in Q2) covering market sizing data and the competitive landscape. These reports are included in our 2023 Premium Subscription Service.
KEY QUESTIONS ADDRESSED ABOUT IOT DEVICES
- How do you define the Building Internet of Things? It is a network connecting all building services which monitors, analyzes, and controls the smart building without the intervention of humans.
- How many connected IoT devices have been installed in commercial smart buildings? Memoori estimates that the commercial buildings sector currently represents around 11.8% of the total installed base of IoT devices worldwide. We forecast that the number of IoT devices used in commercial smart buildings will grow at a 13.7% CAGR between 2023 and 2028, reaching an estimated 3.25 billion devices by 2028.
- What systems account for the most connected IoT devices? In terms of system application, security & access devices account for the biggest percentage, and Memoori estimates it will grow at 11.9% CAGR to reach 646 million connected devices by 2028. HVAC and building energy management devices account for the 2nd biggest percentage.
- What role do Open Standards and Protocols play in driving growth? The rapid pace of IoT innovation necessitates interoperability across all industries, connecting customers, businesses and products. Open standards facilitate the interoperability of IoT systems, which is essential for unlocking the true value of IoT.
Memoori estimates the number of connected IoT devices installed in commercial smart buildings was over 1.5 billion in 2022. Growth in the total installed base is driven by several factors. A greater proportion of companies are now moving beyond the conceptualization and planning phases into the adoption phase for their IoT deployments. In addition, surveys indicate a notable recent rise in the average number of IoT devices being deployed per project, with many device rollouts now including thousands or even tens of thousands of devices.
In the context of smart building systems, Artificial Intelligence (AI) and Machine Learning (ML) technologies are increasingly serving as innovative tools empowering building operators to collect, process, and utilize data within the building. Generative AI models, like GPT-4, offer potential benefits for BIoT systems in terms of natural language processing (NLP) and improved human-AI interactions. Integrating NLP with BIoT systems and data can provide simplified user interfaces, increased adoption, enhanced data analysis, and improved scalability.
WITHIN ITS 163 PAGES AND 22 CHARTS AND TABLES, THE REPORT FILTERS OUT ALL THE KEY FACTS AND DRAWS CONCLUSIONS, SO YOU CAN UNDERSTAND EXACTLY WHAT IS SHAPING THE FUTURE OF COMMERCIAL SMART BUILDINGS.
- The BIoT industry focuses on enhancing data value by improving systems integration and merging networks, systems, sensors, devices, and cloud-based software into a robust and secure architecture. This integration boosts scalability, and flexibility, and reduces costs. Many in the industry advocate adopting a horizontal systems architecture, which uses open standards, open protocols, and non-proprietary solutions.
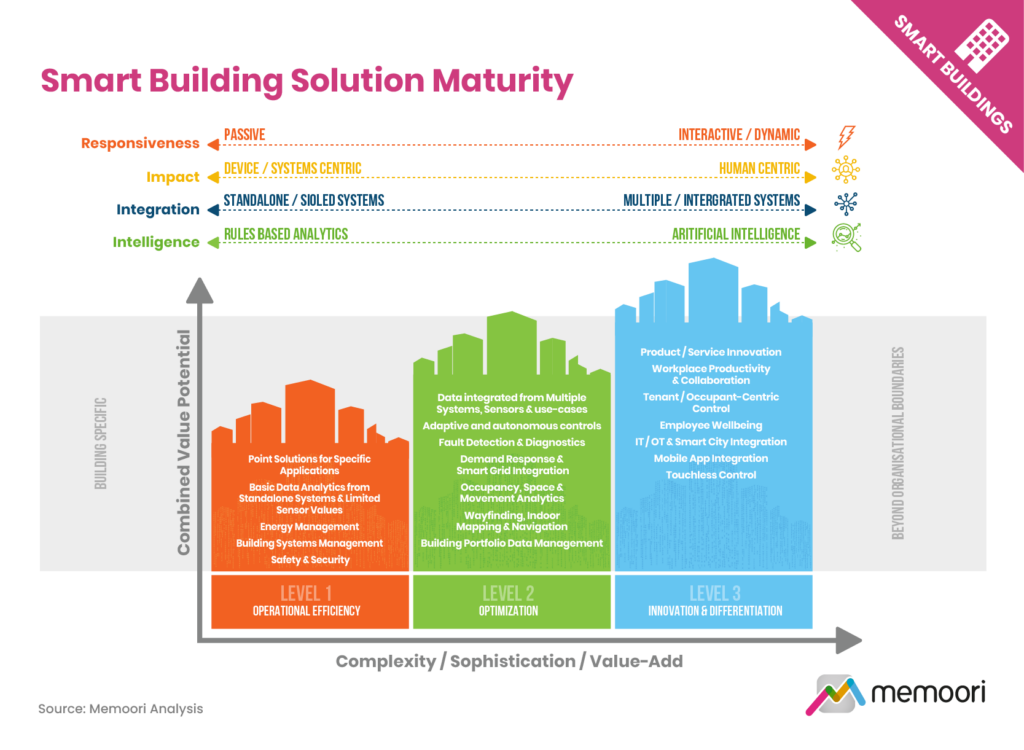
- As of 2021, 33% of commercial real estate assets were still managed manually. The transition to higher levels of BIoT maturity (Levels 2 & 3 in the diagram above) is slowed by challenges such as legacy systems, cost, technical expertise, data privacy and security, interoperability, vendor lock-in, regulatory compliance, change management, and scalability. To facilitate this transition, organizations should adopt a gradual and phased approach to smart building development, prioritizing a roadmap that delivers tangible benefits to stakeholders.
- The commercial real estate sector faces numerous challenges and uncertainties as it contends with the long-term shift towards remote and hybrid working practices and macro factors such as inflationary pressures on energy, labor, and materials.
- The slow and uneven recovery in global office markets is creating a divide between prime and secondary office buildings. Landlords that invest in sustainability credentials, amenities, and digital connectivity will gain a competitive advantage and improve future returns, while outdated buildings risk becoming obsolete.
For only USD $2,000 (Enterprise Wide License) this report provides valuable information to companies so they can improve their strategic planning exercises AND look at the potential for developing their business.
WHO SHOULD BUY THIS REPORT?
The information contained in this report will be of value to all those engaged in managing, operating and investing in commercial smart buildings (and their advisers) around the world. In particular, those wishing to understand exactly how the Internet of Things is impacting commercial real estate will find it most useful.
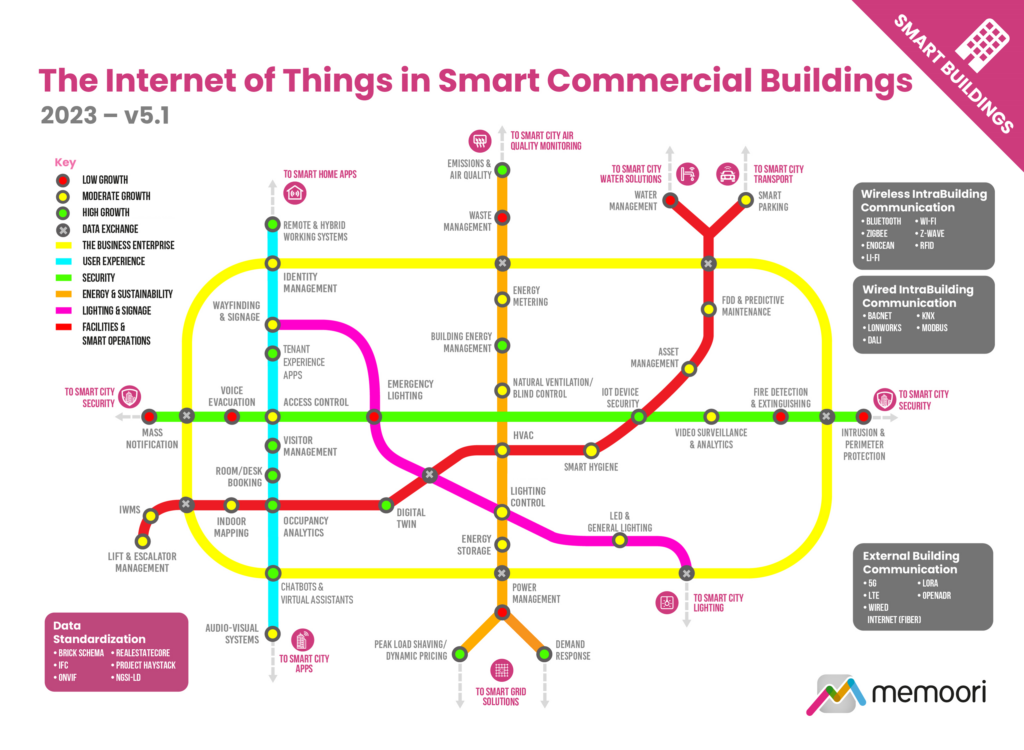
Table of Contents
- Preface
- The Executive Summary
- 1. Key Elements of the IoT
- 1.1 Sensors & Connected Devices
- 1.1.1 IoT Sensors
- 1.1.2 Gateways
- 1.1.3 Actuators
- 1.2 Network Communications
- 1.3 Data Processing (Cloud/Edge)
- 1.3.1 Cloud
- 1.3.2 Edge
- 1.4 Data Processing, Integration & Analytics
- 1.4.1 Data Processing
- 1.4.2 Data Analytics
- 1.4.3 Types of Data Analytics
- 1.5 AI & Machine Learning
- 1.5.1 Introduction to AI and Machine Learning
- 1.5.2 AI Adoption Trends & Market Outlook
- 1.5.3 The Impact of Generative AI
- 1.1 Sensors & Connected Devices
- 2. The Building Internet of Things (BIoT)
- 2.1 Mapping the BIoT
- 2.2 BIoT Solution Architecture
- 3. The State of the Market
- 3.1 IoT Device Projections
- 3.2 IoT Devices in Smart Buildings
- 3.2.1 Installed Based of BIoT Devices in Commercial Smart Buildings
- 3.2.2 BIoT Devices by Market Vertical
- 3.2.3 BIoT Devices by Application
- 3.2.4 BIoT Devices by Region
- 3.3 Market Investment & Adoption Trends
- 3.3.1 Adoption Trends for the Wider IoT
- 3.3.2 BIoT Specific Trends
- 3.4 BIoT Solution Maturity
- 3.5 How AI & Machine Learning Are Impacting the BIoT
- 3.5.1 AI/ML Technologies in BIoT Systems
- 3.5.2 Existing AI/ML Use Cases
- 3.5.3 Challenges and Barriers
- 3.5.4 Future Outlook and Opportunities
- 4. Meta Trend Analysis
- 4.1 Macro Economic Outlook
- 4.1.1 Economic Outlook
- 4.1.2 Inflationary Pressures
- 4.1.3 Corporate Sentiment
- 4.1.4 Banking Sector Woes
- 4.2 Supply Chain Trends
- 4.2.1 Supply Chain Pressures Ease
- 4.2.2 Impacts on IoT Devices & Sensors
- 4.2.3 Building Supply Chain Resilience
- 4.3 Real Estate Trends
- 4.3.1 The Impact of Hybrid Work
- 4.3.2 Commercial Office Space Demand
- 4.3.3 The Flight to Quality
- 4.3.4 A Buyer’s Market
- 4.3.5 Transforming Underutilized Spaces
- 4.3.6 CRE Construction Outlook
- 4.3.7 CRE Sector Performance
- 4.3.8 Implications for IoT Spending
- 4.4 Environmental, Social & Governance Trends (ESG)
- 4.4.1 Environmental factors
- 4.4.2 Social & Wellness factors
- 4.4.3 Governance factors
- 4.5 IoT Skills & Job Markets
- 4.5.1 The Availability of Skilled Professionals
- 4.5.2 Will Tech Sector Layoffs Close the Skills Gap?
- 4.5.3 Educational and Training
- 4.6 The War in Ukraine
- 4.6.1 Energy Impacts
- 4.6.2 Materials Impacts
- 4.6.3 Regional Economic Effects
- 4.7 Geopolitical Tensions & Trade Barriers
- 4.7.1 US/China Dynamics
- 4.7.2 Western Sanctions and Trade Restrictions
- 4.7.3 Chinese Positioning & Response
- 4.1 Macro Economic Outlook
- 5. Standards & Protocols
- 5.1 Integration, Interoperability & Legacy Building Systems
- 5.2 The Importance of Open Standards
- 5.3 Connectivity Standards
- 5.4 Smart Building Protocols
- 5.5 Application Layer Protocols
- 5.6 Building Data Management
- 5.6.1 Project Haystack
- 5.6.2 Brick Schema
- 5.6.3 Google Digital Buildings
- 5.6.4 RealEstateCore
- 5.6.5 Quantum
- 5.6.6 OAP
- 5.6.7 IAP
- 1. Key Elements of the IoT
List of Charts and Figures
- Fig 1.1 Leading Cloud Adoption Approaches for IoT
- Fig 1.2 Leading Drivers for Edge IoT Adoption
- Fig 2.1 The Internet of Things in Smart Commercial Buildings 2023 v5.1
- Fig 3.1 Global IoT Device Projections, Installed Base of Connected Devices (Bn)
- Fig 3.2 Installed Base of IoT Devices in Commercial Smart Buildings 2020 – 2028 (Mn)
- Fig 3.3 IoT & Edge Devices per Deployment
- Fig 3.4 Commercial Smart Building IoT Device Projections by Vertical Market 2023 – 2028 (Mn)
- Fig 3.5 Commercial Smart Building IoT Devices by Application 2023 – 2028 (Mn)
- Fig 3.6 Commercial Smart Building IoT Devices by Region 2023 – 2028 (Mn)
- Fig 3.7 IoT’s Popularity as a Search Term – Interest over Time, Google Trends 2013 – 2023
- Fig 3.8 IoT Technology Adoption Rates, 2021 vs 2022
- Fig 3.9 Real Estate Sector – Expected Changes in Budgets Allocated to Technology in 2023 vs 2022
- Fig 3.10 Sensor & Control Technology Penetration, Share of US Commercial Floorspace that Incorporates Sensor & Control Technologies
- Fig 3.11 Commercial Buildings – Energy Efficiency Related Smart Controls Penetration – % of US Commercial Building Stock by Number of Buildings & Floorspace
- Fig 3.12 Smart Building Solution Maturity
- Fig 4.1 The Internet of Things in Smart Commercial Buildings, Meta Trend Impact Analysis by Application 2023 – 2028
- Fig 4.2 Supply Chain Indicators, Feb 2021 – Feb 2023
- Fig 4.3 First Quarter Gross Leasing Volumes for Offices by Region Q1 2019 – Q4 2022
- Fig 4.4 Global Office Vacancy Rates % Q1 2020 to Q4 2022
- Fig 4.5 US Consensus Construction Forecasts, Selected Sectors
DOWNLOAD THE BROCHURE OR CONTACT US DIRECTLY TO DISCUSS ALTERNATIVE PAYMENT OPTIONS.