
This report is an in-depth study providing a detailed market analysis of video surveillance, with a specific focus on revenues generated by cameras, video storage, software & analytics.
It is a comprehensive overview of the current and anticipated landscape of the video surveillance market. Drawing on in-depth expertise in the fields of Physical Security, IoT, Cyber Security, and Artificial Intelligence, our analysis aims to empower professionals across the industry – from manufacturers to system integrators, from security consultants to end-users.
This report is the first instalment of a two-part series covering Physical Security Technology. Part 2, covering Access Control Systems, is to be published later in Q4 2023. Both these reports are included in Memoori’s 2023 Premium Subscription Service.
Key Questions Addressed:
- What is the size and structure of the global video surveillance market? How is the market broken down into cameras, storage, software and analytics? Where are the dominant geographic markets in the world? How are sales split between 16 different industry verticals?
- What are the main drivers for industry growth? How will the market grow over the next 5 years? Which technologies are helping to reshape this market and create new business models?
- How are mergers, acquisitions and investments impacting the industry? How does acquisition activity stack up against previous years both in terms of value and volume? How much investment has the market attracted from venture capital and private equity this year?
Within its 219 Pages and 19 Charts, This Report Presents All the Key Facts and Draws Conclusions, so you can understand what is Shaping the Future of the Video Surveillance Industry:
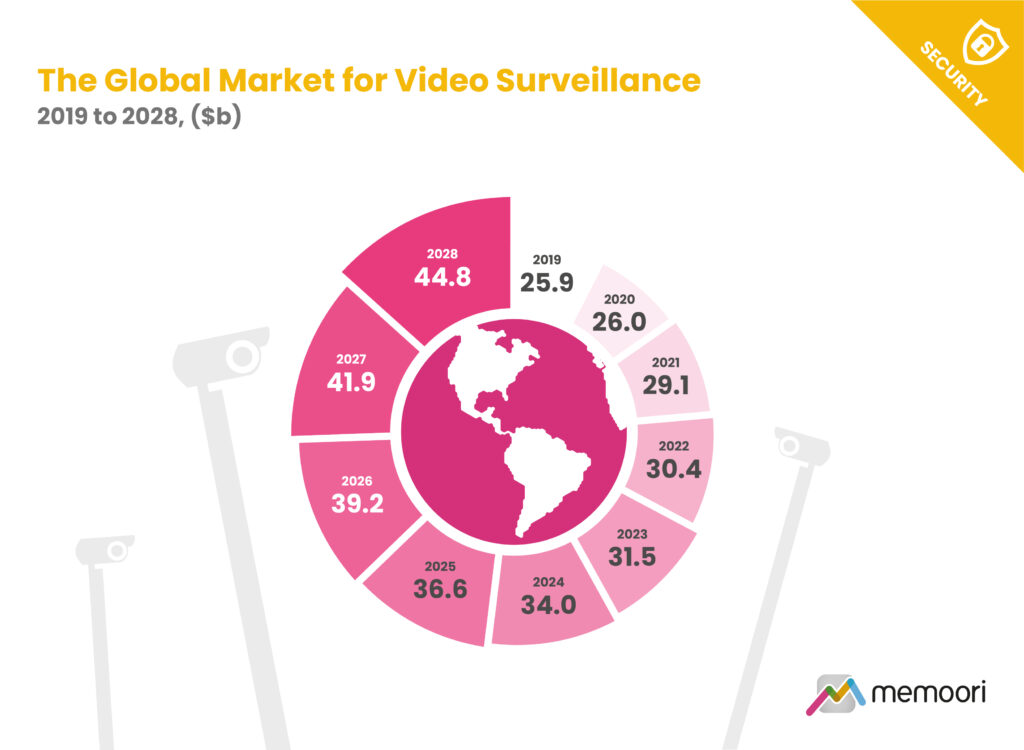
- Total global revenues for video surveillance equipment and software at factory gate prices, reached an estimated $30.4 billion in 2022. This represents healthy 4.5% growth over 2021, albeit lower than the 11.7% rebound in 2021 following pandemic impacts. For the 6-year period between 2022-2028, the market is projected to expand at a 5.7% CAGR, reaching $44.8 billion by 2028.
- The market has seen a major surge in the adoption of AI-enabled cameras capable of edge processing over the past 2-3 years. These cameras come equipped with various AI-powered functionalities, ranging from basic facial recognition in low-end models to more advanced capabilities like 4K resolution, object classification, behaviour analysis and people tracking in high-end models. Our latest estimates forecast that the percentage of network security cameras shipping with built-in AI capabilities will rise steadily from around 18% in 2022 to over 50% by 2028.
- Several interlinked factors are fueling strong demand growth globally for video surveillance solutions. Expanding criminal and terrorist threats have compelled both public and private entities to ramp up security monitoring. However, the video surveillance industry has faced significant supply chain disruptions, product shortages, and cost inflation during the pandemic recovery. Surging demand has outstripped manufacturers’ production capacity, especially for key components like semiconductors.
At only USD $2,000 for an enterprise license, this report provides valuable information into how physical security companies can develop their business strategy through mergers, acquisitions, and alliances.
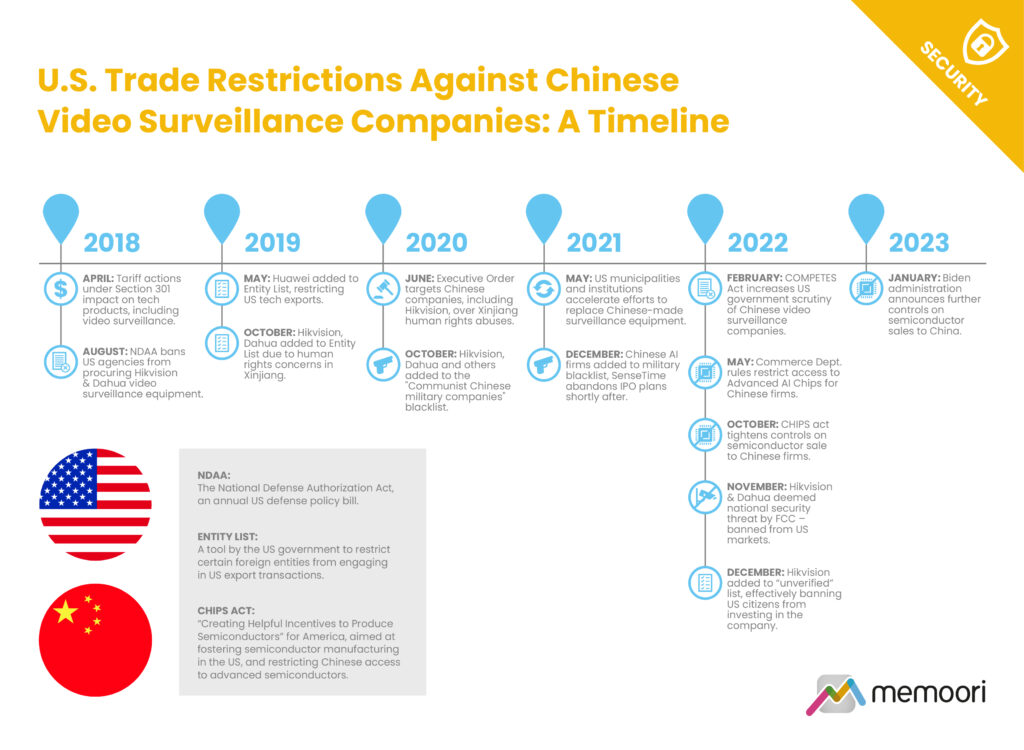
Geopolitical tensions between China and the West have stirred up the video surveillance market, especially impacting leading Chinese vendors Hikvision and Dahua. US bans prohibit government agencies from purchasing their equipment, while export controls limit access to American technology and participation in US capital markets. The US and its allies cite concerns around data security, human rights controversies, and intellectual property practices.
M&A trends point toward increased competition for small vendors, a pivot from hardware to software, the rise of intelligent video, acceleration of cloud adoption, simplified integrated security offerings, and the competitive advantage of global scale.
Investment trends reveal a focus on both scaling mature firms and investing in disruptive startups. Priorities include AI, cloud migration, geographic expansion, and regulatory adaptability. The market remains open to innovation but cautious given economic conditions.
Who Should Buy This Report?
The information in this report will be of value to all those engaged in managing, operating, and investing in electronic security technology companies (and their advisors) around the world. In particular, those wishing to acquire, merge or sell companies will find its contents particularly useful. Want to know more? Download the Brochure.
Table of Contents
- Preface
- Executive Summary
- 1. The Structure & Shape of the Video Surveillance Business
- 1.1 Video Surveillance Market Structure
- 1.2 Company Classifications & Market Share
- 1.3 Market Dynamics (Porter’s Five Forces Analysis)
- 1.4 Sales & Distribution Channels
- 2. The Video Surveillance Market
- 2.1 Video Surveillance Adoption & Investment
- 2.1.1 Market Operation Conditions
- 2.1.2 Key Adoption Drivers
- 2.1.3 Physical Security Spending Plans & Budgets
- 2.2 Video Surveillance Market Size & Growth Forecasts
- 2.3 Market Size, Growth & Trends by Major Region
- 2.3.1 North America
- 2.3.2 Latin America & The Caribbean
- 2.3.3 China
- 2.3.4 The Rest of Asia Pacific
- 2.3.5 Europe
- 2.3.6 Middle East & Africa
- 2.4 Market Size & Trends by Vertical
- 2.4.1 Offices
- 2.4.2 Healthcare
- 2.4.3 Education
- 2.4.4 Retail
- 2.4.5 Hospitality
- 2.4.6 Industrial
- 2.4.7 Public Infrastructure & City Surveillance
- 2.4.8 Data Centers
- 2.4.9 Transportation
- 2.5 Video Cameras
- 2.6 Video Surveillance Cameras
- 2.6.1 Market Size & Growth Trends
- 2.6.2 Market Dynamics
- 2.6.3 Key Players & Vendor Landscape
- 2.7 Body Worn Cameras
- 2.7.1 Market Size & Growth Trends
- 2.7.2 Market Dynamics
- 2.7.3 Key Players & Vendor Landscape
- 2.8 Thermal Cameras
- 2.8.1 Market Size & Growth Trends
- 2.8.2 Market Dynamics
- 2.8.3 Key Players & Vendor Landscape
- 2.9 Video Surveillance Software & Analytics
- 2.9.1 Market Size & Growth Trends
- 2.9.2 Market Dynamics
- 2.9.3 Key Players & Vendor Landscape
- 2.10 VSaaS & Cloud
- 2.10.1 Market Dynamics
- 2.10.2 VSaaS Business Models and Competitive Landscape
- 2.10.3 Technology and Operational Insights
- 2.10.4 Cost and Regulatory Factors
- 2.11 Video Storage Hardware & Services
- 2.11.1 Market Size & Growth Trends
- 2.11.2 Market Dynamics
- 2.11.3 Key Players & Vendor Landscape
- 2.1 Video Surveillance Adoption & Investment
- 3. IP Connectivity & the IoT
- 3.1 The Convergence of IP and IoT
- 3.2 The Benefits of IoT-Enabled Video Surveillance
- 3.3 IoT Growth & Adoption Trends
- 3.4 Challenges Associated with IoT Adoption
- 3.5 The Role of Systems Integrators
- 4. AI & Machine Learning
- 4.1 Market Growth & Adoption
- 4.2 Applications & Use Cases
- 4.2.1 Safety and Security-Related Applications
- 4.2.2 Additional Applications Providing Wider Benefits
- 4.2.3 Encoding & Compression
- 4.3 Edge Devices and Hardware Enablers
- 4.4 Hardware Enablers: AI Chips, AI NVRs, and AI Cameras
- 4.1.1 AI Chips
- 4.4.2 AI Network Video Recorders (NVRs)
- 4.4.3 AI Cameras
- 4.5 The AI Vendor Landscape
- 4.6 New Product Releases
- 5. Wireless & Cellular Technology
- 5.1 Wireless Transmission Methods
- 5.1.1 4G
- 5.1.2 WiFi
- 5.1.3 5G
- 5.1.4 Private LTE/5G Networks
- 5.2 Key Benefits
- 5.3 Challenges & Considerations for Wireless
- 5.4 Potential Use Cases for 5G
- 5.5 Wireless & 5G Cameras
- 5.5.1 Wireless
- 5.5.2 5G
- 5.1 Wireless Transmission Methods
- 6. Other Notable Technology Drivers
- 6.1 Image Quality / Resolution
- 6.1.1 Market Adoption and Evolution
- 6.1.2 Application-Specific Resolution Requirements
- 6.1.3 Technical Considerations
- 6.2 Low Light / Infra-Red / Night Vision
- 6.2.1 Super Low Light Camera Technology
- 6.2.2 Integrated IR Camera Technology and Applications
- 6.2.3 Speciality Low Light Cameras
- 6.3 Multi-Sensor Devices
- 6.3.1 Overview and Benefits
- 6.3.2 Market Adoption & Evolution
- 6.3.3 Technical Considerations
- 6.4 Advanced Threat Detection Systems
- 6.4.1 Introduction and Specialized Threat Detection Categories
- 6.4.2 Market Drivers & Dynamics
- 6.4.3 Notable Vendors & Market Offerings
- 6.5 Integration & Interoperability
- 6.5.1 Benefits of Interoperability
- 6.5.2 The Evolution Towards Open Platforms
- 6.5.3 ONVIF Standards
- 6.5.4 Integration Between Video Surveillance, Physical Security and Building Systems
- 6.1 Image Quality / Resolution
- 7. Geopolitical Tensions & Trade Barriers
- 7.1 US/China Dynamics
- 7.1.1 Potential Future US Restrictions
- 7.1.2 Reciprocal Chinese Government Trade Restrictions
- 7.2 Trade Barriers by Other Countries and Regions
- 7.3 Implications of Trade Barriers
- 7.3.1 Impact on Chinese Manufacturers
- 7.3.2 Strategic Responses of Chinese Manufacturers
- 7.3.3 The Realities of Trading in China for non-Chinese firms
- 7.3.4 Corporate Responses to Chinese Video Surveillance Controversies
- 7.3.5 Implications for Non-Chinese Vendors
- 7.3.6 Long-Term Impacts on Global Supply Chains
- 7.3.7 Potential for New Competitors
- 7.3.8 Uncertain Future Direction
- 7.4 The War in Ukraine
- 7.1 US/China Dynamics
- 8. Supply Chain Trends
- 8.1 A Retrospective of Pandemic Impacts
- 8.2 Rising Costs Squeeze Company Margins
- 8.3 The Current State of Video Surveillance Supply Chains
- 8.4 Building Supply Chain Resilience for the Future
- 9. Sustainability
- 9.1 The Environmental Impact of Video Surveillance Systems
- 9.2 Manufacturers’ Sustainability Efforts and Commitments
- 9.3 Leveraging Video for Sustainability Initiatives
- 9.4 Developing Resilient and Future-Proof Surveillance Systems
- 10. Skills, Talent & Labor
- 10.1 Key Challenges
- 10.2 Emerging Opportunities
- 11. Cybersecurity
- 11.1 Key Threats and Vulnerabilities
- 11.2 Major Cybersecurity Incidents
- 11.3 Supply Chain Risks
- 11.4 Regulations and Compliance
- 11.5 Breach & Vulnerability Disclosure
- 11.6 Mitigation Best Practices
- 12. Data Privacy & Ethics
- 12.1 Privacy Considerations
- 12.2 Privacy Regulations
- 12.3 Facial Recognition Challenges & Regulations
- 12.4 Ethical Implementation and AI Bias
- 13. Mergers & Acquisitions
- 13.1 Historic M&A Performance in the Physical Security Market
- 13.2 Key M&A Deals Since 2018
- 13.3 Key Deals to the end of September 2022
- 13.4 M&A Deals to the end of September 2023
- 13.5 M&A Trends and Implications
- 13.5.1 Notable Trends
- 13.5.2 Implications
- 14. Strategic Alliances
- 14.1 Historic Strategic Alliances in the Physical Security Market
- 14.2 New Strategic Alliances to the end of September 2023
- 14.3 Strategic Alliance Trends and Implications
- 15. Investment Trends
- 15.1 Investment Dynamics
- 15.2 Key Deals to the end of September 2022
- 15.3 Investment Deals to the end of September 2023
- 15.4 Investment Trend Observations & Implications
List of Charts and Figures
- Fig 1.1 – Video Surveillance Market Structure
- Fig 1.2 – Video Surveillance Sales by Major Grouping, Number of Companies, % of Global Sales in 2022
- Fig 1.3 – Market Share of Global Video Surveillance Sales by Major Vendor 2022
- Fig1.4 – Average Revenue for Group A, B, C & D Companies
- Fig 1.5 – Video Surveillance Market: Porter’s Five Forces Analysis
- Fig 2.1 – The Security Market Index (SMI)
- Fig 2.2 – The Global Market for Video Surveillance 2019 to 2028 ($b)
- Fig 2.3 – The Global Market for Video Surveillance by Category 2019 to 2028 ($b)
- Fig 2.4 – Video Surveillance Sales by Region in 2022
- Fig 2.5 – Video Surveillance Sales by Region 2019 to 2028 ($b)
- Fig 2.6 – Estimated Distribution of Video Surveillance Solutions by Building Type in 2023
- Fig 2.7 – Global Sales of Video Surveillance Cameras by Type 2019 to 2028 ($b)
- Fig 2.8 – Global Video Surveillance Camera Market – Analog and IP Camera Market Share 2019 to 2028
- Fig 2.9 – Global Sales of Video Management Software (VMS) & Analytics 2019 to 2028 ($b)
- Fig 2.10 – Global Sales of Video Storage Hardware & Services 2019 to 2028 ($b)
- Fig 4.1 – Global AI Video Surveillance Camera Shipments, % of Overall Video Surveillance Camera Shipments 2022 to 2028
- Fig 7.1 – US Trade Restrictions Against Chinese Video Surveillance Companies: A Timeline
- Fig 13.1 – Security Deals Completed from 2002 to 2022, Estimated Total Value of Deals ($m)
- Fig 14.1 – Strategic Alliances 2008 to 2023
Appendix A
- In-Depth Company Profiles
Companies Mentioned Include AMONG OTHERS;
ACRE | ADT | Alarm.com | Ambient.ai | American Healthcare Video | Anixter | Anixter | Arecont Vision | Arlo | Athena Security | Avigilon | Awiros | AWS | Axon | Axis Communications | Becklar | Bosch | BriefCam | Canon | Checkpoint Systems | China Mobile | Cisco | Cloudview | Cognitec | Convergint | Costar | CP Plus | Dahua | Deep North | Deep Sentinel | DeepSight AI Labs | Defendry | Delta | Digital Ally | Digital Barriers | Eagle Eye Networks | Earthcam | Exacq | Eyeforce | Flock Safety | Genetec | GeoVision | Gorilla Technology | Hanwha Vision | Hikvision | Hitachi | Honeywell | Huawei | IBM | IDIS | IMI | Intel | Intelbras | IntelliVision | i-PRO | Iristy | IronYun | Johnson Controls | Kingston | Konica Minolta | Lorex | Loss Prevention Systems | March Networks | Micron | Microsoft | Milesight | Mobotix | Motorola Solutions | NEC | Netview | NVIDIA | Omnilert | OnSSI | Oosto | OpenEye | Panasonic | PayByFace | Pelco | Qognify | Qolsys | Qualcomm | Quantum | Qumulex | Reolink | Resideo Technologies Inc | Reveal Media | Rhombus Systems | Samsung | SanDisk | Scylla | Seagate | Secom Co | Sensormatic | Shooter Detection Systems | Skywatch | Solink | Sony | SoundThinking | Spot AI | STMicroelectronics | Teledyne Flir | Texas Instruments | Tiandy Technologies | TKH Security | Toshiba | Ubiquiti | Uncanny Vision | Uniview | Vaxtor | Verkada | VideoIQ | Videotec | Vievu | Vintra | Vivotek | Western Digital | Wolfcom Enterprises | ZeroEyes